Skip to content

ENH: plot flight center-of-pressure evolution (#954) - #1130

Open
thatrandomasiandev wants to merge 3 commits into
RocketPy-Team:developfrom
thatrandomasiandev:enh/954-cp-evolution-plot
Open

ENH: plot flight center-of-pressure evolution (#954)#1130
thatrandomasiandev wants to merge 3 commits into
RocketPy-Team:developfrom
thatrandomasiandev:enh/954-cp-evolution-plot

Conversation

@thatrandomasiandev

Copy link
Copy Markdown

Summary

  • Add Flight.plots.center_of_pressure() to plot CP position vs time, evaluated at the flight Mach number at each step
  • Overlay center of mass on the same axis and static margin on a twin axis, with out-of-rail / burnout / apogee markers
  • Wire the new plot into Flight.plots.all() and cover show/save paths in unit tests

Fixes #954

Test plan

  • PYTEST_DISABLE_PLUGIN_AUTOLOAD=1 MPLBACKEND=Agg python -m pytest tests/unit/test_plots.py::test_flight_center_of_pressure_plot -q
  • Manual: flight.plots.center_of_pressure() on a Calisto flight shows CP/CM/static-margin curves through first event time

@thatrandomasiandev
thatrandomasiandev requested a review from a team as a code owner August 11, 2026 01:38
@Gui-FernandesBR

Copy link
Copy Markdown
Member

we need to see one or two examples of the new plot before merging it please

@codecov

codecov Bot commented Aug 11, 2026

Copy link
Copy Markdown

Codecov Report

✅ All modified and coverable lines are covered by tests.
✅ Project coverage is 82.54%. Comparing base (e0ff281) to head (28e496c).
⚠️ Report is 43 commits behind head on develop.

Additional details and impacted files
@@             Coverage Diff             @@
##           develop    #1130      +/-   ##
===========================================
+ Coverage    82.18%   82.54%   +0.36%     
===========================================
  Files          122      128       +6     
  Lines        16355    16644     +289     
===========================================
+ Hits         13441    13739     +298     
+ Misses        2914     2905       -9     

☔ View full report in Codecov by Harness.
📢 Have feedback on the report? Share it here.

🚀 New features to boost your workflow:
  • ❄️ Test Analytics: Detect flaky tests, report on failures, and find test suite problems.

@thatrandomasiandev

Copy link
Copy Markdown
Author

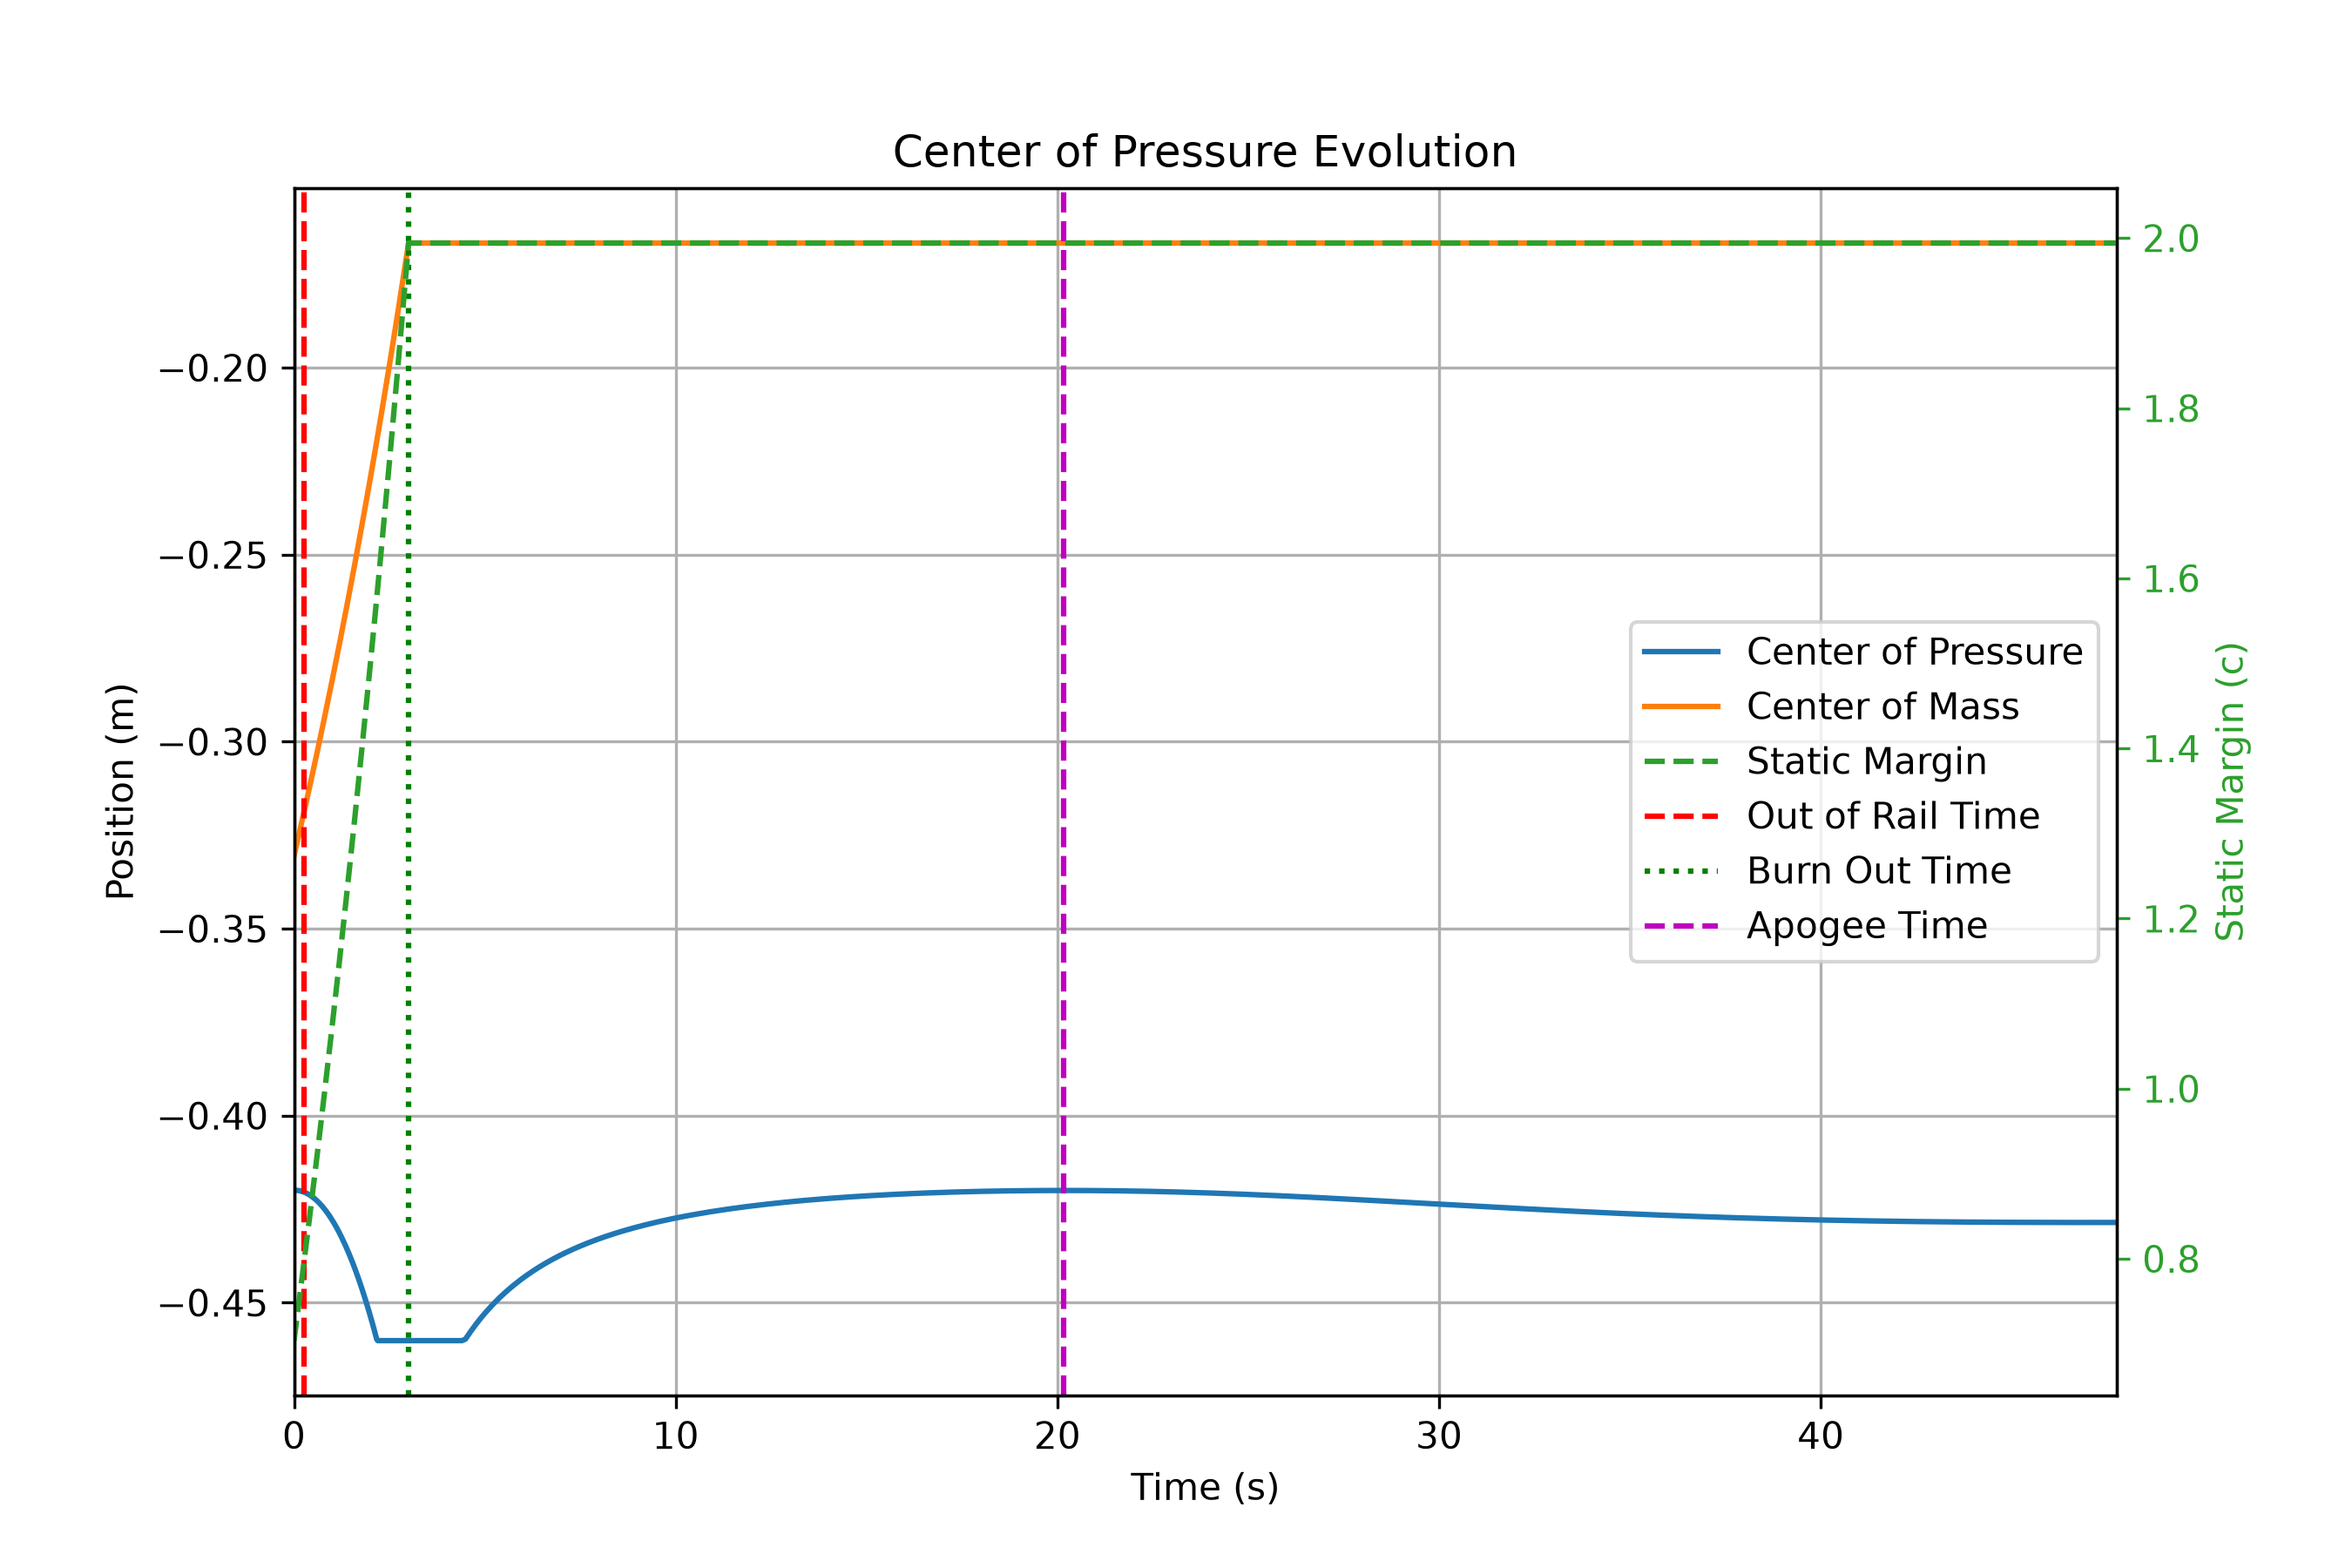
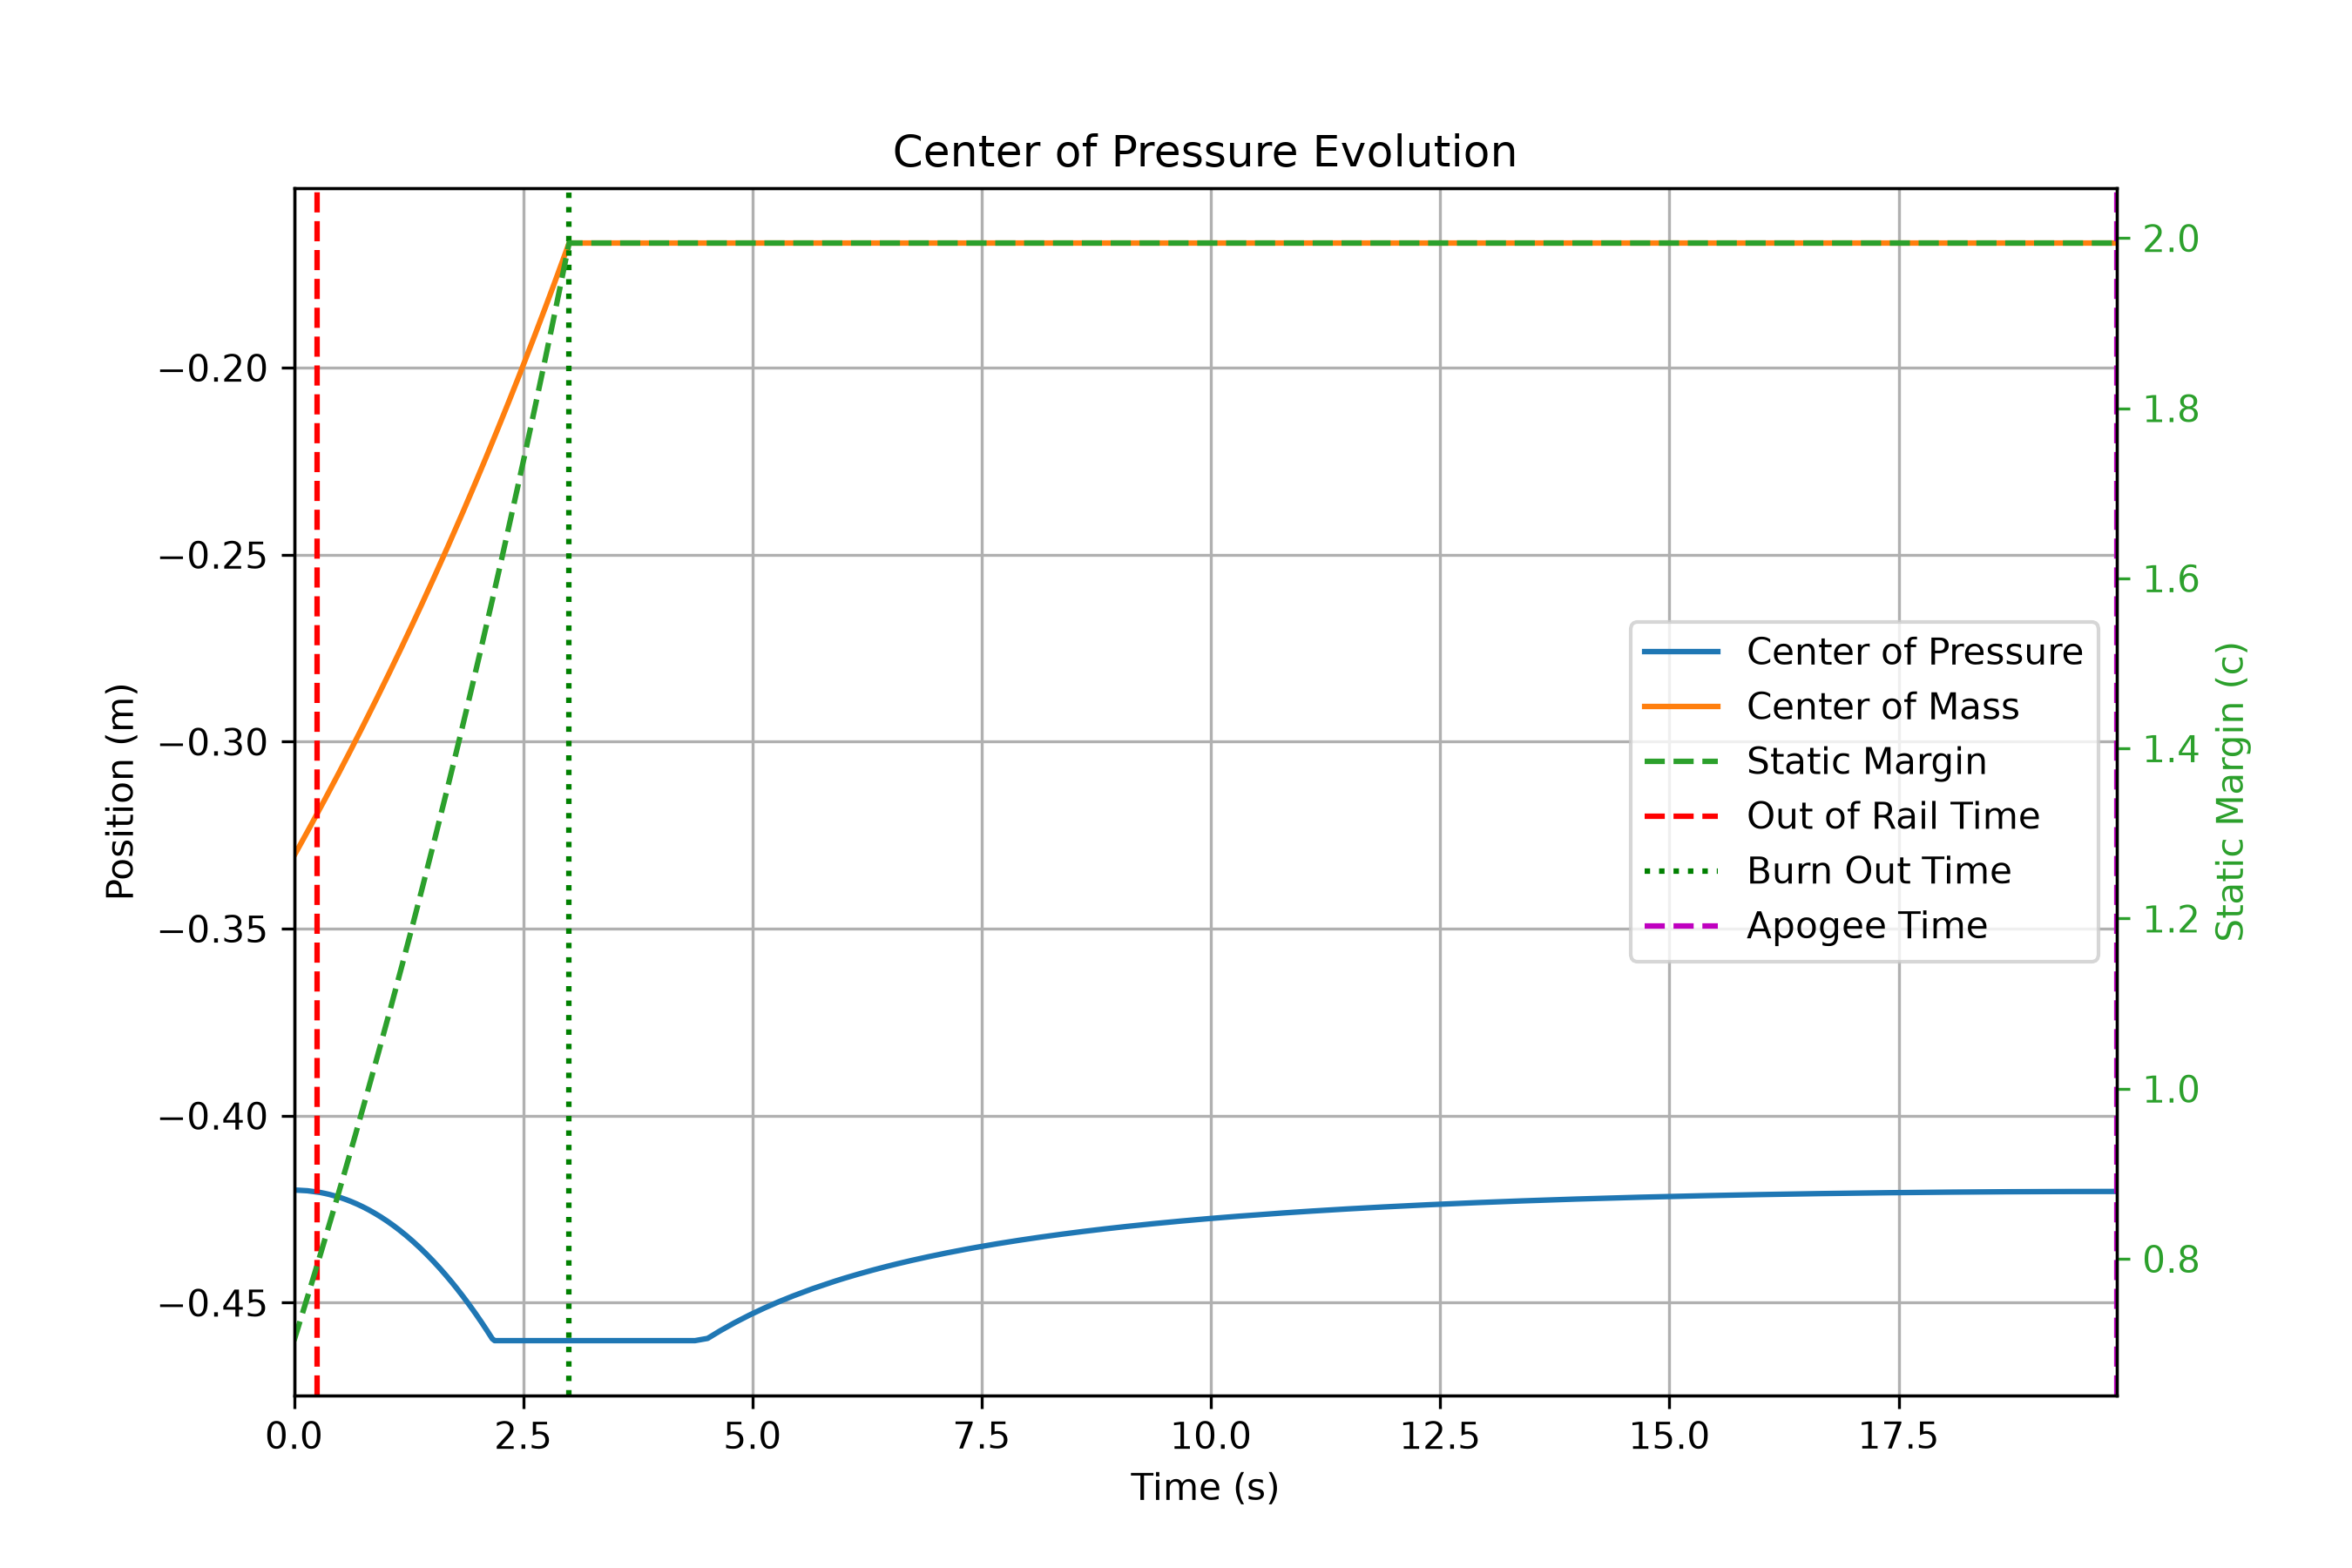
@Gui-FernandesBR here are two examples from this branch:

  1. Full-ish ascent (rail → burnout → apogee window), truncated at first_event_time like other stability plots:
    cp evolution

  2. terminate_on_apogee=True:
    cp to apogee

Both generated with flight.plots.center_of_pressure(filename=...) under MPLBACKEND=Agg. Happy to tweak axis limits / twin-axis layout if you want something closer to the existing stability plots.

@Gui-FernandesBR

Copy link
Copy Markdown
Member

the example plots don't really make sense

Sign up for free to join this conversation on GitHub. Already have an account? Sign in to comment

Labels

None yet

Projects

None yet

Development

Successfully merging this pull request may close these issues.

2 participants